

Performance data analysis is a critical stage in strategic planning and performance management, providing decision-makers with the insights and deep understanding needed to identify key performance drivers and pinpoint development opportunities. This program aims to enhance participants’ knowledge and skills in analyzing data using descriptive, diagnostic, predictive, and prescriptive analytical tools. It also covers skills for visually presenting data to support performance improvement decisions effectively. The program includes numerous practical applications where participants analyze data for examples in sectors such as healthcare, education, tourism, municipalities, agriculture, and security.
- Program Objectives
Upon completing the program, participants will be able to:
- Explore modern trends in data analysis and visualization.
- Understand different data scales and the appropriate analysis for each.
- Apply measures of central tendency.
- Use inferential analysis tools for forecasting and hypothesis testing.
- Employ correlation and regression methods to study relationships between multiple variables.
- Conduct variance analysis and identify sources of variance.
- Utilize forecasting equations.
- Recognize various types of data visualization.
- Identify key applications for data analysis and visualization.
- Apply data storytelling techniques.
- Use MS Power BI to build KPI dashboards.
- Target Audience
- Senior management leaders.
- Members of vision realization offices.
- Members of strategic planning departments.
- Performance ambassadors.
- Members of performance management departments.
- Project managers.
- Internal audit department staff.
- Individuals interested in preparing performance reports.
- Members of organizational development and quality departments.
- Certificate Sample

- Sample Training Materials


Please provide your contact information, and our team will reach out to you as soon as possible.
Contact Us
Training Program Content
Intellectual Property Rights
Role of Data Analysis in Strategic Planning and Performance Management
- Role of Data Analysis in Strategic Planning and Performance Management
Types of Data Scales
- Types of Data Scales
Data Collection Sources
- Data Collection Sources
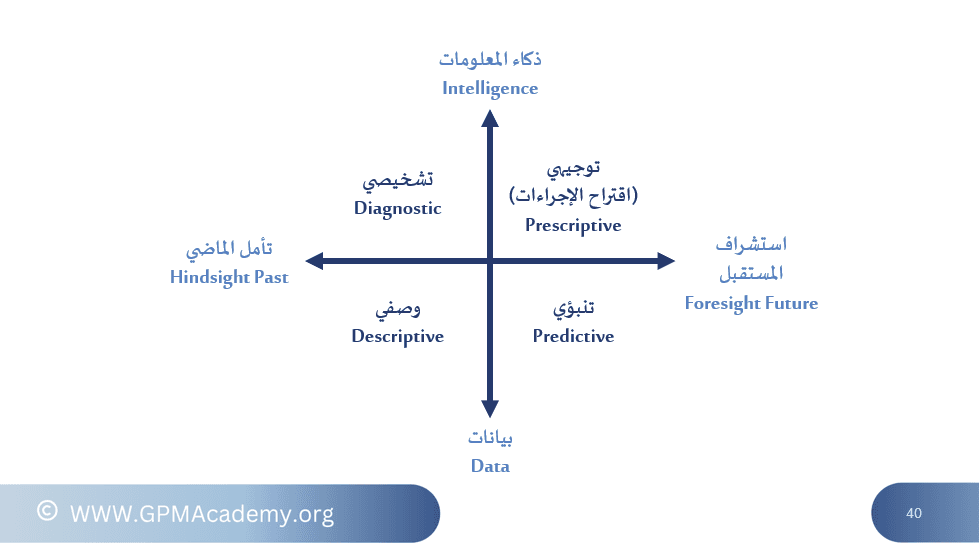
Types of Data Analytics
- Types of Data Analytics
Types of Data Analytics: Application to Heatstroke Case Indicator
- Application to Heatstroke Case Indicator
Data Analytics Exercises: Unemployment and Small Enterprises
- Exercises: Unemployment and Small Enterprises
Using Data Analytics to Predict Average Life Expectancy
- Using Data Analytics to Predict Average Life Expectancy
Modern Trends in Data Analysis
- Modern Trends in Data Analysis
Data Cleansing
- Data Cleansing
Using Excel for Data Import
- Using Excel for Data Import
Using Excel for Data Cleansing: Text Data
- Using Excel for Data Cleansing: Text Data
Using Excel for Data Cleansing: Numerical Data
- Using Excel for Data Cleansing: Numerical Data
Basic Statistical Concepts
- Basic Statistical Concepts
Measures of Central Tendency
- Measures of Central Tendency
Measures of Dispersion
- Measures of Dispersion
Measures of Skewness
- Measures of Skewness
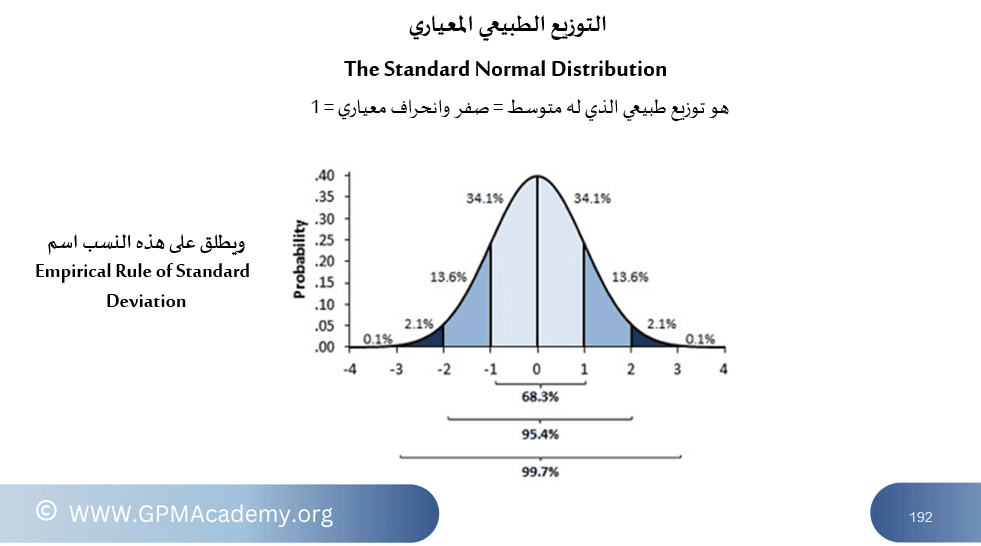
Normal Distribution and Standardized Values
- Normal Distribution and Standardized Values
Standardized Comparison of Obesity Rates in Iraq vs. the UK
- Standardized Comparison of Obesity Rates in Iraq vs. the UK
Statistical Estimation
- Statistical Estimation
Hypothesis Testing
- Hypothesis Testing
Correlation Coefficient
- Correlation Coefficient
Simple Linear Regression
- Simple Linear Regression
Tabular and Graphical Data Presentation
- Tabular and Graphical Data Presentation
Univariate and Bivariate Tabular Analysis
- Univariate and Bivariate Tabular Analysis
Using Excel for Tabular Analysis of Descriptive Data
- Using Excel for Tabular Analysis of Descriptive Data
Using Excel for Tabular Analysis of Quantitative Data
- Using Excel for Tabular Analysis of Quantitative Data
Using Excel to Create Graphical Data Presentations
- Using Excel to Create Graphical Data Presentations
Practical Application: Developing a KPI Dashboard
- Practical Application: Developing a KPI Dashboard (Repeated for Emphasis)
Business Intelligence Analysis Tools
- Business Intelligence Analysis Tools
Power BI Desktop Basics
- Power BI Desktop Basics
Power BI Data Aggregation
- Power BI Data Aggregation
Power BI Data Model Building
- Power BI Data Model Building
Power BI Data Update
- Power BI Data Update
Power BI Visualization 1: Data Presentation
- Power BI Visualization 1: Data Presentation
Power BI Visualization 2: Data Presentation
- Power BI Visualization 2: Data Presentation
Power BI Visualization 3: Data Presentation
- Power BI Visualization 3: Data Presentation
Power BI Historical Data Comparison
- Power BI Historical Data Comparison
Power BI Forecasting: Predicting Future Data
- Power BI Forecasting: Predicting Future Data
Data Sharing
- Data Sharing
Power BI Dashboard: Building a KPI Dashboard
- Power BI Dashboard: Building a KPI Dashboard
Data Import
- Data Import
Certification Exam
- Performance Data Analysis and Visualization Program Exam (C7)
About the Author
Dr. Mohammed Mustafa Mahmoud (Dr. 3M)
- Director of Professional Certification Programs, Global Performance Management Academy, Toronto, Canada.
- Holds a PhD in Business Administration (Decision-Making Science) and three Master’s degrees (Management, Civil Engineering, Regional Planning) from the University of Pennsylvania, Philadelphia, USA.
- 46 years of professional experience:
- 20 years as a university professor in the USA, Egypt, Kuwait, and Canada.
- 26 years in strategic planning, performance measurement, and leadership development.
- Served as a consultant to the Ministers of Labor, Health, and Economy and Planning in Saudi Arabia.
- Contributed to developing performance indicators for Saudi Vision 2030 and created a methodology for measuring organizational maturity in performance management for public entities.
- Supervised and reviewed hundreds of strategic plans, performance indicators, and performance reports.
- Served as Strategy Management Director for 5 years at the Jeddah Governorate Municipality.
- Contributed to developing performance indicators for the Guests of Rahman Program and the National Industrial Development and Logistics Program.
- Designed hundreds of Balanced Scorecards for government bodies, private organizations, charities, and universities.
- Developed a methodology for measuring and improving board effectiveness, applied in various private and nonprofit organizations.
- Contributed to establishing academies such as Savola Academy, Panda Academy, and the Knowledge City Institute for Leadership and Entrepreneurship.
Program Statistics
- 12 Training Programs
- +111 Registered Trainees
- Not Enrolled
- Program Cost: $486.00 USD
- Program Content: 48 Lessons
- Certification Exam for Program Completion
- Training Program Certificate