

In today’s fast-paced retail environment, staying ahead requires more than just intuition—it demands a strategic, data-driven approach. This article explores how Global Retail Outlets (GRO) leverages a system dynamics model within the Balanced Scorecard (BSC) framework to navigate challenges like supply chain disruptions, market competition, and evolving consumer preferences. By integrating feedback loops, causal relationships, and dynamic simulations, GRO aligns its financial goals, customer satisfaction, operational efficiency, and employee growth into a cohesive strategy. Discover how this innovative approach can transform your retail strategy and drive sustainable success.
System Dynamics Model for a Retail Chain Using the Balanced Scorecard (BSC)
This example demonstrates how a retail chain can use a system dynamics model to develop its strategy within the Balanced Scorecard (BSC) framework. The retail chain, “Global Retail Outlets (GRO),” aims to improve financial performance, enhance customer satisfaction, optimize internal operations, and promote employee growth while addressing systemic challenges such as supply chain disruptions, market competition, and changing consumer preferences.
Background
Global Retail Outlets aligns its strategic objectives with the four perspectives of the Balanced Scorecard:
- Financial: Achieve sustainable revenue growth, profitability, and return on investment.
- Customer: Enhance customer satisfaction, loyalty, and market share.
- Internal Processes: Improve operational efficiency, supply chain management, and inventory turnover.
- Learning and Growth: Invest in employee training, technology, and innovation.
GRO faces challenges such as:
- Competition from e-commerce platforms.
- Supply chain disruptions due to global events.
- Rapidly changing consumer preferences and demand patterns.
Key Components of the System Dynamics Model
- Feedback Loops
- Reinforcing Loop (R1 – Customer Loyalty):
- Improved employee training in product knowledge and customer service → Better customer interactions → Increased customer satisfaction → Enhanced brand loyalty → Higher repeat purchases → Increased profitability → Further investment in employee training.
- Balancing Loop (B1 – Inventory Management):
- Increased demand for products → Higher inventory levels → Increased storage costs → Reduced profitability → Reduced inventory levels.
Example in Action:
- A reinforcing loop highlights how investing in employee knowledge and service quality drives customer satisfaction and financial performance.
- A balancing loop illustrates how managing inventory effectively is critical to maintaining profitability.
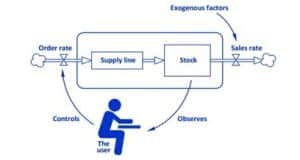
- Stock-and-Flow Structures
- Stocks:
- Employees: Number of trained retail and management staff.
- Customers: Number of active customers.
- Inventory: Value or quantity of products in stock.
- Capital Reserves: Funds available for investments and operations.
- Flows:
- Employee Training Rate: Rate at which employees are trained.
- Customer Acquisition Rate: Rate at which new customers are acquired.
- Inventory Replenishment Rate: Rate at which new inventory is ordered and received.
- Sales Rate: Rate at which products are sold.
Example in Action:
- The model tracks how increasing the employee training rate impacts customer satisfaction, sales, and profitability over time.
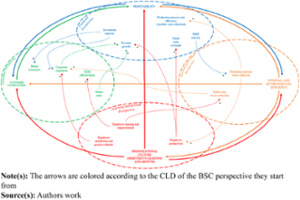
- Causal Loop Diagrams (CLDs)

A CLD, as described in the OCR of the attached image, helps map relationships between key variables within the retail chain:
Examples of Causal Relationships:
- Employee Training (Learning/Growth) → Customer Experience (Customer) → Customer Satisfaction (Customer) → Sales Growth (Financial) → Profitability (Financial).
- Efficient Supply Chain (Internal Processes) → Reduced Costs (Financial) → Increased Profitability (Financial)
- Increased IT systems efficiency (Internal Processes) → Employee Satisfaction and productivity increase (learning and Growth)
Example in Action:
- The CLD reveals that improving IT system efficiency (part of internal processes) directly influences employee satisfaction and productivity (part of learning and growth), thereby impacting overall profitability (financial perspective).
- Time Delays
The model incorporates delays between actions and their outcomes:
- Employee training takes one month to improve customer interactions.
- Investments in technology take six months to streamline supply chain operations.
- Marketing efforts take 3 months to translate into increased sales.
Example in Action:
- The model predicts that while implementing new inventory management software will not immediately reduce storage costs, it will lead to a significant decrease within six months.
- System Boundaries
The system includes internal factors (e.g., employee skills, inventory levels) and external factors (e.g., market competition, consumer preferences). Broader economic trends are excluded for simplicity.
Example in Action:
- The boundaries ensure the model focuses on factors directly influencing retail performance while excluding broader macroeconomic variables like GDP growth.
- Dynamic Strategy Maps
A dynamic strategy map links strategic objectives across the BSC perspectives:
- Financial: Improve profitability by increasing sales and managing costs.
- Customer: Enhance customer loyalty and satisfaction.
- Internal Processes: Optimize supply chain efficiency and streamline operations.
- Learning/Growth: Invest in employee training and innovative technologies.
Example in Action:
- The strategy map dynamically shows how improving employee training programs (Learning/Growth perspective) impacts both customer service quality (Customer perspective) and profitability (Financial perspective).
- Simulation Models

Using software like Vensim or Stella, GRO runs simulations to test various strategies:
- Scenario A: Increase investment in employee training for customer service by reallocating 10% of the marketing budget.
- Scenario B: Implement new inventory management software to optimize stock levels.
- Scenario C: Focus on expanding online sales channels to reach new customers.
Example in Action:
- Simulations reveal that Scenario B provides immediate benefits by reducing inventory costs, while Scenario A offers long-term improvements in customer loyalty.
- Policy Design and Scenario Testing
Policies are designed based on simulation results:
- Policy A: Allocate 15% of annual revenue to employee training programs focused on customer service and product knowledge.
- Policy B: Introduce a dynamic pricing model to optimize inventory turnover.
- Policy C: Partner with local delivery services to improve online order fulfillment.
Scenario testing evaluates trade-offs between policies:
- Policy A improves customer satisfaction but requires upfront investment in training programs.
- Policy B reduces inventory costs but may impact customer satisfaction due to fluctuating prices.
- Data Integration
Historical data on customer satisfaction scores, inventory turnover rates, and employee performance are integrated into the model for calibration.
Example in Action:
- Data from past marketing campaigns is used to refine predictions about customer acquisition and sales growth.
Outcome of the Model
The system dynamics model provides actionable insights for Global Retail Outlets:
- Investing in employee training enhances customer loyalty and drives financial performance but requires strategic planning of training programs.
- Implementing inventory management software reduces storage costs and improves operational efficiency but may require careful integration with existing systems.
- Expanding online sales channels reaches new customers but requires optimized logistics for order fulfillment.
Key Performance Indicators (KPIs) for a System Dynamics Model in Retail
A system dynamics model for a retail chain should include KPIs that align with the Balanced Scorecard (BSC) framework. These KPIs provide measurable metrics to assess performance across the four BSC perspectives: Financial, Customer, Internal Processes, and Learning & Growth. Below is a comprehensive list of KPIs categorized by perspective, along with their relevance to system dynamics modeling.
- Financial Perspective
These KPIs measure the financial health and profitability of the retail chain.
- Revenue Growth Rate: Tracks the percentage increase in revenue over time to measure financial success12.
- Gross Margin Return on Investment (GMROI): Evaluates inventory profitability by comparing gross margin to inventory investment12.
- Cost of Goods Sold (COGS) as a Percentage of Sales: Monitors how efficiently the business manages product costs relative to sales12.
- Operating Cash Flow (OCF): Measures the cash generated from operations, critical for sustaining and growing the business12.
- Net Profit Margin: Indicates overall profitability after accounting for all expenses5.
- Customer Perspective
These KPIs focus on customer satisfaction, loyalty, and engagement.
- Customer Satisfaction Score (CSAT): Measures customer satisfaction with products and services23.
- Net Promoter Score (NPS): Gauges customer loyalty by asking how likely they are to recommend the store to others2.
- Customer Retention Rate: Tracks the percentage of customers who return over a specific period, reflecting loyalty24.
- Average Transaction Value (ATV): Measures the average amount spent per transaction, indicating upselling effectiveness13.
- Foot Traffic (Online and In-store): Monitors customer visits to stores or websites, providing insights into marketing effectiveness1.
- Internal Processes Perspective
These KPIs evaluate operational efficiency and supply chain management.
- Inventory Turnover: Tracks how often inventory is sold and replaced over a specific period, indicating stock efficiency12.
- Days Sales of Inventory (DSI): Measures how long it takes to sell inventory, helping balance supply and demand13.
- Stock-to-Sales Ratio: Compares stock levels to sales volume, ensuring optimal inventory levels2.
- Order Fulfillment Time: Monitors how quickly orders are processed and delivered, reflecting operational efficiency6.
- Return Rate: Tracks the percentage of returned items, highlighting issues with product quality or customer expectations3.
- Learning & Growth Perspective
These KPIs measure employee performance, training effectiveness, and innovation.
- Employee Turnover Rate: Indicates staff retention levels and potential issues with job satisfaction or management23.
- Sales Per Employee: Measures employee productivity by dividing total sales by the number of employees23.
- Training Completion Rate: Tracks the percentage of staff who complete training programs, reflecting investment in workforce development6.
- Technology Utilization Rate: Monitors how effectively employees use digital tools for operations or customer service5.
- Innovation Index: Evaluates the introduction of new products or services and their contribution to revenue growth6.
How These KPIs Are Used in a System Dynamics Model
- Feedback Loops
System dynamics models incorporate feedback loops to show how changes in one KPI affect others:
- Example: Increased investment in employee training (Learning & Growth) improves customer satisfaction (Customer), leading to higher sales (Financial), which funds further training programs.
- Stock-and-Flow Structures
KPIs are used as stocks or flows in system dynamics models:
- Example:
- Stock: Inventory levels.
- Flow: Inventory turnover rate.
- The model tracks how changes in stock levels impact order fulfillment time and customer satisfaction.
- Scenario Testing
The model can simulate different strategies using these KPIs:
- Example:
- Scenario A: Increase marketing spend to boost foot traffic.
- Scenario B: Optimize inventory management to reduce DSI.
- Scenario C: Invest in employee training to improve sales per employee.
- Time Delays
System dynamics accounts for delays between actions and outcomes:
- Example:
- Training programs take months to improve employee productivity.
- Marketing campaigns may take weeks to increase foot traffic.
- Causal Relationships
Causal loop diagrams link KPIs across perspectives:
- Example:
- Employee training → Customer service quality → Customer satisfaction → Repeat purchases → Revenue growth.
Conclusion
- This detailed example shows how a retail chain can effectively integrate system dynamics modeling with the Balanced Scorecard framework to align strategic objectives across financial, customer, internal process, and learning/growth perspectives. By incorporating feedback loops, stock-and-flow structures, causal relationships, time delays, dynamic strategy maps, simulations, scenario testing, and data integration, Global Retail Outlets can make informed decisions that balance short-term needs with long-term sustainability and competitiveness in the retail industry.
- By integrating these KPIs into a system dynamics model aligned with the Balanced Scorecard framework, retail chains can simulate strategies, identify bottlenecks, and make data-driven decisions. This approach ensures alignment between financial goals, customer satisfaction, operational efficiency, and workforce development for long-term success.
Citations:
- https://pplx-res.cloudinary.com/image/upload/v1740725128/user_uploads/ggQwfNvcNapuTcE/image.jpg
- https://improvado.io/blog/retail-kpi
- https://insightsoftware.com/blog/retail-kpis-and-metrics-for-reporting/
- https://www.plecto.com/blog/motivation/retail-kpis/
- https://www.netsuite.com/portal/resource/articles/financial-management/retail-kpis.shtml
- https://www.investopedia.com/terms/k/kpi.asp
- https://www.clicdata.com/blog/10-essential-kpis-for-retail/
- https://www.retail-week.com/analysis/analysis-10-key-performance-indicators-for-the-new-retailing-world/7011249.article
#RetailStrategy #SystemDynamics #BalancedScorecard #DataDrivenDecisions #CustomerSatisfaction #OperationalEfficiency #EmployeeGrowth #RetailInnovation #SupplyChainManagement #KPIs #RetailSuccess #StrategicPlanning #BusinessGrowth #RetailTrends #Leadership


